

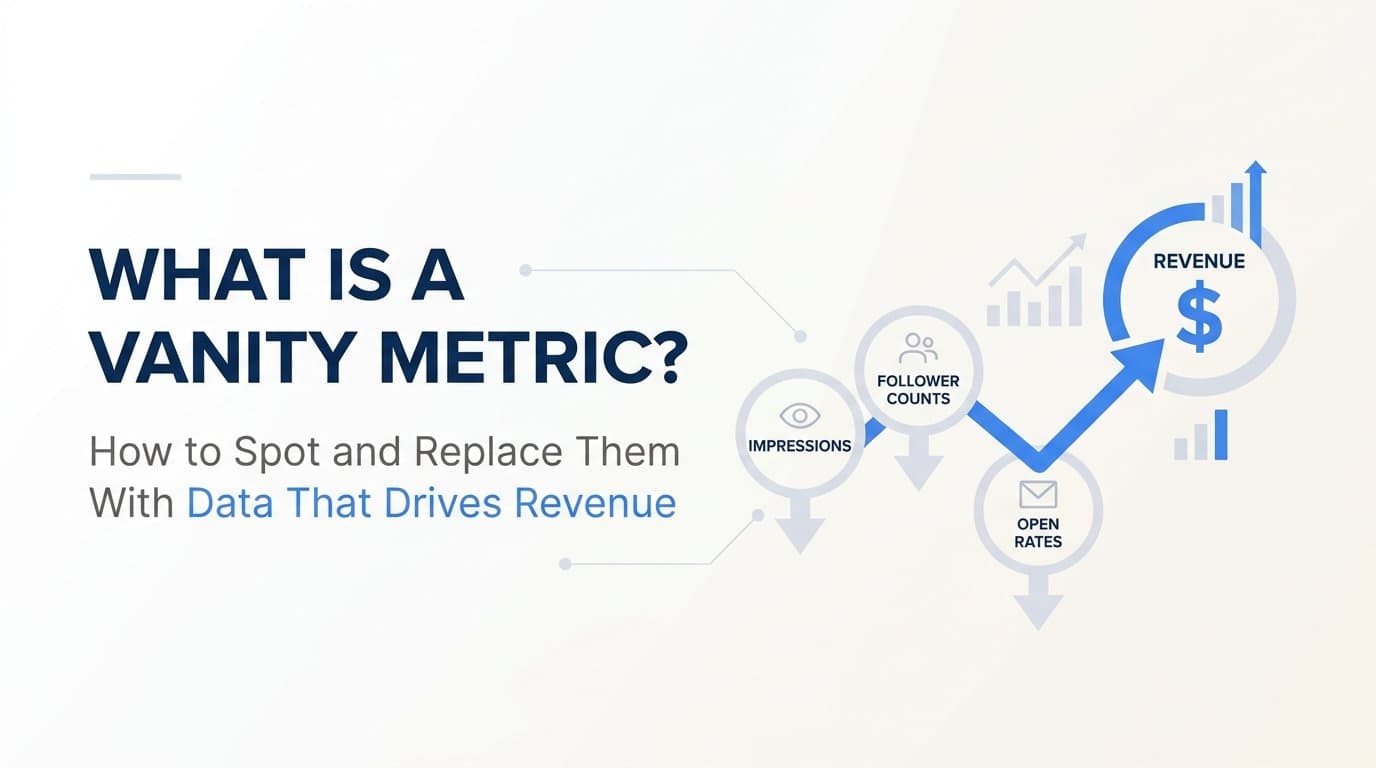
Picture this: your marketing team just wrapped a major campaign. The numbers look incredible. Impressions are through the roof, social followers jumped by thousands, and the email open rate hit an all-time high. Someone puts together a slide deck, leadership nods with approval, and everyone feels like the quarter is off to a strong start.
Then the pipeline report comes in. Flat. Revenue? Also flat. The leads that came through were either unqualified or simply never converted. All that momentum, all those impressive numbers, and the business has nothing material to show for it.
This is the vanity metric trap, and it catches even experienced B2B SaaS marketing teams. The problem is not that marketers are lazy or dishonest. It is that the metrics most dashboards surface by default tend to be the ones that trend upward and feel good, not the ones that actually predict whether your business is growing. Understanding what a vanity metric is, why these numbers are so persistent, and how to replace them with data that connects to revenue is one of the most important shifts a growth-focused marketing team can make.
By the time you finish this article, you will be able to identify vanity metrics in your own reporting, understand the structural reasons they stick around, and build a measurement framework grounded in business outcomes rather than surface-level signals.
The Numbers That Feel Good but Tell You Nothing
So what exactly is a vanity metric? At its core, a vanity metric is any measurement that appears to indicate progress or success but cannot be reliably connected to a business outcome like pipeline growth, revenue, customer acquisition, or retention.
The term became widely recognized through Eric Ries's work on the Lean Startup methodology, where he drew a sharp distinction between actionable metrics and vanity metrics. Actionable metrics inform a specific decision. Vanity metrics make you feel good without telling you what to do next.
The psychological pull of vanity metrics is real and worth acknowledging. These numbers are easy to collect, they tend to trend upward over time simply because audiences and traffic grow naturally, and they create a visible sense of momentum. When you can point to a chart that goes up and to the right, it feels like progress, even if that chart has no relationship to revenue.
There is also a comfort factor. Vanity metrics rarely require hard decisions. If impressions are high, you do not need to question your targeting. If follower counts are growing, you do not need to audit your content strategy. The numbers give you cover to keep doing what you are doing without examining whether it is actually working.
The critical distinction to understand is that the difference between a vanity metric and an actionable metric is not always about the metric itself. It is about whether that metric informs a specific decision or predicts a meaningful outcome. Click-through rate on a paid ad, for example, is often dismissed as a vanity metric. But if you can connect CTR to pipeline contribution by campaign, it becomes genuinely useful data. The number alone is not the problem. The problem is measuring it in isolation, without the downstream context that reveals whether it actually matters.
This is the foundation everything else builds on: metrics derive their value from their connection to outcomes. If a number cannot be tied to a decision or a result, it belongs in the background, not on your primary dashboard.
Common Vanity Metrics in B2B SaaS Marketing
Knowing the definition is one thing. Recognizing vanity metrics in the wild is another. Here are the most frequently cited examples in B2B SaaS marketing contexts, along with an honest look at why each one can mislead.
Total website traffic: High session counts feel like validation that your content and SEO strategy are working. But traffic without conversion context is just noise. If ten thousand visitors land on your site and none of them start a trial, request a demo, or move into your pipeline, the traffic number tells you almost nothing about marketing effectiveness. The real question is what percentage of that traffic converts, and at which stage.
Social media followers and page likes: A large following can signal brand awareness, but in B2B SaaS, follower counts rarely correlate with pipeline unless you are also tracking engagement quality and intent signals. A competitor with half your follower count but a highly engaged audience of decision-makers in your ICP will likely outperform you on revenue generation.
Email open rates: This one became even more complicated after Apple's Mail Privacy Protection changes, which artificially inflate open rate data by pre-loading email content. Even before that shift, open rate in isolation told you very little about whether your email program was driving qualified leads or revenue. Reply rate, click-to-conversion rate, and pipeline influenced by email sequences are far more meaningful.
Raw ad impressions: Impressions measure how many times your ad was displayed, not whether it reached the right people or drove any action. In a B2B SaaS context where your ICP might represent a narrow slice of the market, a high impression count can actually indicate wasted spend on irrelevant audiences.
Total leads generated: This is perhaps the most seductive vanity metric in B2B SaaS marketing. Lead volume feels like a direct indicator of marketing success, but without qualification filters, a spike in leads can mask a drop in lead quality. A campaign that generates twice the leads at a fraction of the pipeline contribution is not a win.
Here is the nuance that matters most: some of these metrics are not inherently useless. They become vanity metrics when measured in isolation. Click-through rate paired with pipeline-per-campaign data becomes a meaningful optimization signal. Total leads filtered by qualification rate and cost-per-opportunity becomes a real performance indicator. Context and connection to downstream outcomes are what separate signal from noise.
Why Marketing Teams Keep Tracking the Wrong Numbers
If vanity metrics are so clearly problematic, why do smart marketing teams keep relying on them? The answer is structural, not personal.
The first reason is reporting cadence. Most marketing teams report on a weekly or monthly basis, and the pressure to show progress creates a gravitational pull toward metrics that consistently trend upward. Impressions grow. Follower counts grow. Traffic grows. Pipeline is lumpy, revenue is lagging, and CAC by channel requires work to calculate. When you need something to present in a Monday meeting, the easy numbers win by default.
The second reason is misalignment between marketing KPIs and revenue goals. When marketing is measured on lead volume or traffic rather than pipeline contribution or revenue influence, the team naturally optimizes for what they are being measured on. This is rational behavior, not a failure of judgment. The problem is upstream, in how goals are set and how success is defined organizationally.
The third reason is tool defaults. Most ad platforms and analytics tools surface engagement metrics prominently because those are the metrics they can measure reliably within their own ecosystem. Google Ads will show you impressions, clicks, and CTR with confidence. Connecting those clicks to closed-won revenue in your CRM requires additional infrastructure that many teams have not built.
This leads to the attribution gap, which is arguably the core driver of vanity metric dependency. When marketing teams cannot connect their ad spend and campaign activity to actual revenue outcomes, they default to reporting what is measurable rather than what matters. Over time, this creates a feedback loop: the team gets comfortable reporting on engagement metrics, leadership gets used to seeing them, and the organizational conversation never shifts to revenue contribution.
The cost of this feedback loop is significant. Decisions made on vanity data lead to budget misallocation. Campaigns that generate impressive impressions but no pipeline get scaled because the numbers look good. Channels that quietly drive qualified leads but do not produce flashy top-of-funnel metrics get deprioritized. Over time, the gap between marketing activity and revenue outcomes widens, and the team loses credibility with finance and leadership when they cannot explain what their spend actually produced.
Breaking this cycle requires both a mindset shift and a technology shift. You need to decide to measure outcomes, and you need the infrastructure to make that possible.
The Metrics That Actually Move the Business Forward
The antidote to vanity metrics is not fewer metrics. It is metrics that are tied to business outcomes and capable of informing specific decisions. Here is what that looks like in practice for a B2B SaaS marketing team.
Cost per qualified lead (CPQL): Unlike cost per lead, CPQL filters for leads that meet your ICP criteria and have demonstrated intent. This metric directly informs decisions about channel efficiency and audience targeting. If one channel delivers qualified leads at half the cost of another, that is a budget reallocation decision waiting to happen.
Pipeline generated by channel and campaign: This is the metric that most directly connects marketing activity to business outcomes. Knowing which channels and campaigns are producing the most pipeline-per-dollar allows you to scale what works and cut what does not, with confidence grounded in revenue data rather than engagement proxies.
Customer acquisition cost (CAC) by channel: CAC at the aggregate level is a useful business metric. CAC broken down by channel is a strategic decision-making tool. It reveals which acquisition paths are sustainable and which are quietly eroding unit economics.
Revenue attributed to specific campaigns: This is the north star metric for marketing in B2B SaaS. When you can trace closed-won revenue back to the specific campaigns and channels that influenced the deal, you have a true measure of marketing ROI. Everything else is an approximation.
Conversion rate by funnel stage: Knowing your overall conversion rate from visitor to customer is useful. Knowing where in the funnel leads are dropping off is actionable. If your MQL-to-SQL conversion rate drops sharply, that points to a qualification or handoff problem. If your SQL-to-opportunity rate is low, that signals a sales process or messaging issue. Stage-level conversion data tells you exactly where to focus.
None of these metrics are accessible without proper attribution tracking across the full customer journey. This is the critical point: you cannot replace vanity metrics with meaningful ones if your tracking infrastructure only captures the top of the funnel. Multi-touch attribution, which distributes credit across all the touchpoints that influenced a conversion rather than assigning it all to the first or last interaction, is what makes revenue-connected reporting possible. Without it, even well-intentioned teams end up measuring proxies instead of outcomes.
How to Audit Your Current Metrics and Eliminate the Noise
Knowing which metrics matter in theory is different from knowing which of your current metrics to keep, cut, or reframe. Here is a practical framework for auditing what you are tracking right now.
Apply three questions to every metric on your dashboard:
1. Does this metric inform a specific decision? If you cannot name the decision it would influence, it probably does not belong on your primary reporting dashboard.
2. Does it connect to a revenue or pipeline outcome? Either directly, or through a clear chain of causation. If the answer requires a lot of assumptions, treat it as a supporting metric, not a primary one.
3. Would a change in this number cause us to act differently? This is the most clarifying question. If impressions dropped by thirty percent next month, would you do anything differently? If the honest answer is no, that metric is not driving decisions, it is just occupying space.
Walk through your current reporting dashboards with these three questions and mark each metric as primary, supporting, or decorative. Primary metrics survive all three questions. Supporting metrics answer one or two but require additional context to be actionable. Decorative metrics fail all three and should be deprioritized or removed.
One important prerequisite: this audit only works if your tracking infrastructure is actually capturing the full customer journey. If you do not have visibility into what happens after a lead enters your CRM, or if your ad platform data is disconnected from your revenue data, you will not be able to replace the vanity metrics you eliminate with meaningful alternatives. The audit surfaces the problem. Fixing the tracking infrastructure is what makes the solution possible.
Teams that skip this infrastructure step often end up in a frustrating middle ground: they know their current metrics are insufficient, but they cannot build better ones because the data simply is not there. Investing in full-funnel tracking is not optional if you want to make this shift stick.
Building a Measurement Framework That Connects Ads to Revenue
A revenue-connected measurement framework for B2B SaaS marketing looks like this: every touchpoint from the first ad interaction through CRM stages to closed-won is tracked, and revenue is attributed back to the specific campaigns and channels that contributed to it. That is the goal. Here is what it takes to build it.
The foundation is connecting your data sources. Your ad platforms, your website, and your CRM need to speak to each other. When a prospect clicks a LinkedIn ad, visits your website, downloads a resource, and then books a demo three weeks later after seeing a retargeting ad, every one of those touchpoints needs to be captured and associated with the same customer journey. Without that connectivity, you are left with fragmented data that can only tell you pieces of the story.
Multi-touch attribution is what makes this framework actionable. Instead of crediting the entire conversion to the last click or the first click, multi-touch models distribute credit across the touchpoints that actually influenced the deal. This gives you a realistic picture of how your channels work together, which is especially important in B2B SaaS where the sales cycle is long and involves multiple interactions across multiple channels before a deal closes.
Server-side tracking has become increasingly important as browser-based tracking has become less reliable due to privacy changes and ad blockers. Conversion API integrations with platforms like Meta and Google allow you to send enriched, accurate conversion data directly from your server, bypassing the limitations of browser cookies. This keeps your attribution data clean and ensures that your ad platform algorithms are optimizing on real conversion signals rather than degraded browser data.
This is exactly the infrastructure that Cometly is built to provide. Cometly connects your ad platforms, CRM, and website events into a single source of truth, tracking every touchpoint from the first ad click through to closed-won revenue. Instead of reporting on impressions and follower counts, your team can analyze pipeline generated by campaign, cost per qualified lead by channel, and revenue attributed to specific ad spend. The AI-driven recommendations surface which campaigns are actually driving revenue, so you can scale with confidence rather than guesswork.
When your measurement framework is built on this kind of full-funnel visibility, the conversation in your marketing team changes. You stop defending impression counts and start presenting pipeline contribution. You stop scaling campaigns because they look good and start scaling them because you can see the revenue they produce.
Putting It All Together
Vanity metrics are not inherently evil. Some of them, like total traffic or social reach, have a legitimate role in understanding brand awareness and campaign scale. The danger is when they replace revenue-connected data in marketing decision-making, when impressions become a substitute for pipeline and follower counts stand in for customer acquisition.
The shift from vanity reporting to outcome-based reporting is not just a tactical change. It is a strategic one. Teams that measure what actually matters make better budget decisions, earn more credibility with leadership, and build growth strategies that compound over time because they are grounded in what is actually working.
Start this week by running the three-question audit on your current dashboard. For every metric you track, ask whether it informs a decision, connects to a revenue outcome, and would change your behavior if it moved. The metrics that survive all three questions are your foundation. The ones that do not are candidates for removal or recontextualization.
Then look honestly at your tracking infrastructure. If you cannot connect your ad spend to pipeline and revenue today, that is the gap to close. Without full-funnel visibility, even the best measurement intentions hit a ceiling.
Ready to move from surface-level metrics to revenue-connected attribution? Cometly gives B2B SaaS marketing teams the full-funnel visibility they need to see exactly which ads and channels drive pipeline and closed-won revenue. Get your free demo and start building a measurement framework that connects every ad dollar to the outcomes that actually matter.



