

Picture this: your marketing team just wrapped a major campaign. Website traffic is up. Social impressions hit a new record. The dashboard looks great, and the weekly report to leadership feels like a victory lap. Then someone asks the question that changes the room: "So why is pipeline still flat?"
This tension is more common than most B2B SaaS marketing teams want to admit. The numbers look good, the effort was real, but revenue hasn't moved. The problem isn't the campaign. The problem is what you're measuring.
Not all metrics are created equal. Some exist to make you feel productive. Others exist to tell you what to do next. In B2B SaaS, where sales cycles are long, buyers interact across multiple channels, and every dollar of ad spend needs to connect to pipeline, the difference between these two categories isn't just academic. It's the difference between scaling confidently and flying blind.
This article gives you a practical framework for telling the difference between vanity metrics and actionable metrics, explains where most teams go wrong, and shows you how to build a measurement approach that connects your marketing activity directly to revenue.
The Numbers That Look Good But Mean Nothing
Vanity metrics are data points that are easy to collect, visually impressive, and emotionally satisfying. They trend upward with minimal effort, they look great in a slide deck, and they rarely reveal anything uncomfortable about actual business performance. That combination makes them surprisingly persistent in marketing reporting.
In B2B SaaS marketing, the most common vanity metrics include total website page views, social media follower counts, email open rates reported in isolation, ad impressions, raw reach numbers, and total clicks without any conversion context. Each of these can feel meaningful in the moment. None of them, on their own, tell you whether your marketing is generating pipeline or revenue.
Think about page views. A surge in traffic sounds like progress. But if that traffic comes from an irrelevant audience, bounces immediately, and never converts into a lead, the number is meaningless for your business goals. The same logic applies to social followers. Growing an audience of people who never become customers is a branding exercise at best and a distraction at worst.
Email open rates have a similar problem. An open is a passive action. It tells you the subject line worked, not that the message drove any decision. When open rates are reported without connecting them to click-through rates, form fills, or downstream conversions, they measure attention, not intent.
So why do vanity metrics stick around? A few reasons. First, they are readily available in almost every platform dashboard. Meta Ads Manager, Google Analytics, and email tools all surface these numbers prominently because they are easy to calculate and they look like activity. Second, they trend upward with almost any increase in spend or output, which makes them comfortable to report. Spending more on ads will almost always increase impressions. Posting more content will almost always grow followers over time. These metrics reward volume, not quality.
Third, and perhaps most importantly, vanity metrics are emotionally safe. They allow marketing teams to show leadership that things are moving without exposing the harder question of whether any of that movement is translating into revenue. When the pressure to demonstrate value is high and the attribution data is incomplete, vanity metrics become a convenient shield.
The cost of that comfort is real. Teams optimizing for impressions and traffic are allocating budget toward the wrong outcomes. The longer that pattern continues, the harder it becomes to connect marketing activity to business results and the harder it becomes to earn budget increases that are actually deserved.
What Separates an Actionable Metric From the Noise
An actionable metric is a measurement that directly informs a specific decision. It connects to a business outcome, changes how you allocate resources, or tells you what to do next. If a metric cannot answer the question "what should we do differently based on this number?", it is not actionable.
There are three practical tests worth applying to any metric you're considering tracking. First, does it connect to revenue or pipeline? A metric that has no visible path to a closed deal or a qualified opportunity is unlikely to drive meaningful decisions. Second, can you act on it immediately? Actionable metrics give you clear direction. If the number goes up, you scale. If it goes down, you investigate and adjust. Third, does it change how you allocate budget or creative resources? If the answer is no, the metric belongs in a diagnostic layer, not your primary reporting.
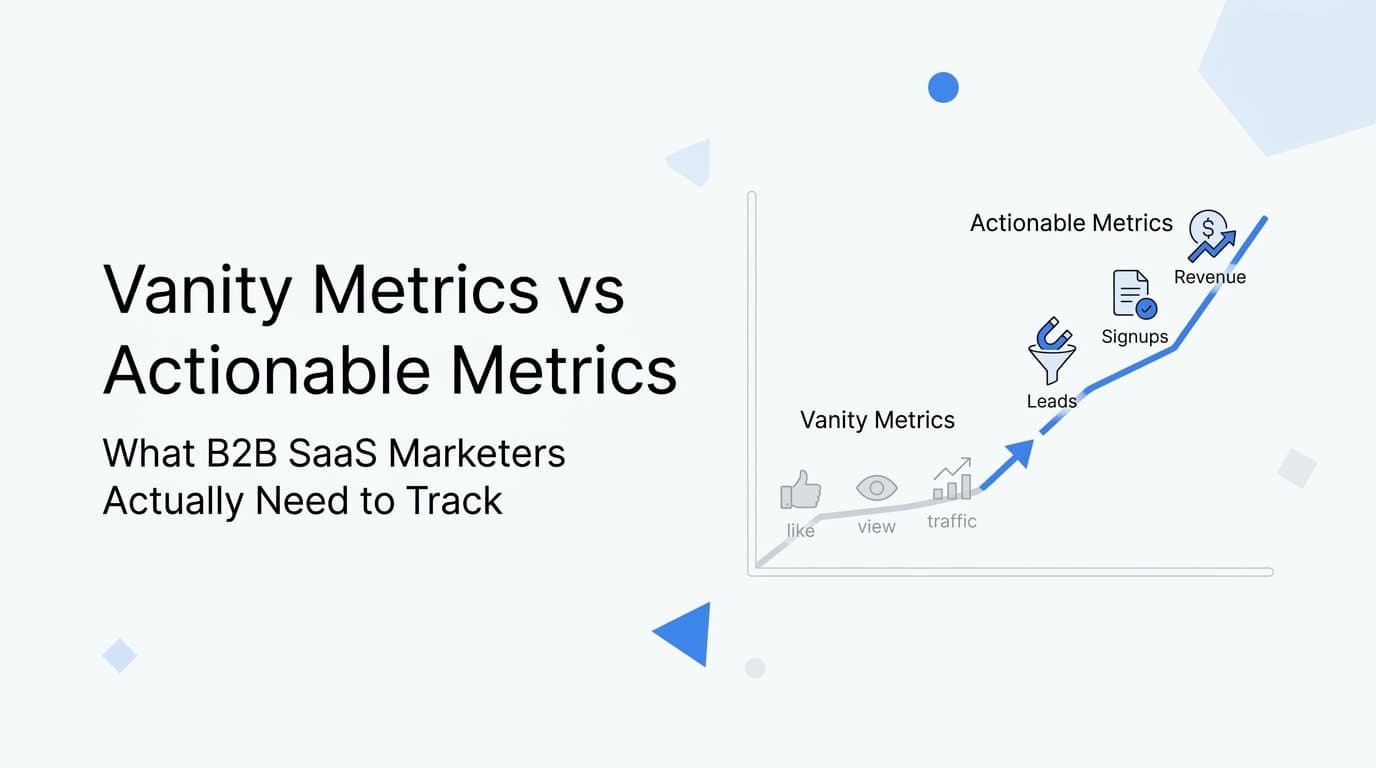
The contrast between vanity metrics and actionable metrics becomes clearest when you put them side by side. Impressions versus cost per qualified lead. Total clicks versus click-to-conversion rate by campaign. Social followers versus attributed pipeline from social ads. In each pairing, the first number is easy to collect and easy to grow. The second number is harder to get right, but it is the one that tells you where to put your money.
Cost per qualified lead tells you how efficiently a channel is generating demand worth pursuing. Click-to-conversion rate tells you whether your creative and landing page are working together to move people forward. Attributed pipeline from social ads tells you whether the channel is actually influencing deals, not just generating awareness.
Other high-value actionable metrics for B2B SaaS marketing teams include cost per sales-accepted opportunity, customer acquisition cost by channel, and revenue attributed to specific campaigns. These numbers are harder to produce because they require connecting ad data to CRM data to revenue data. That connection is exactly what makes them worth building.
The natural question is: how do you know which metrics belong in which category for your team? Start with the decisions you actually make. If a number has changed how you've allocated budget or adjusted creative in the past quarter, it's actionable for your context. If it's only shown up in reports without changing anything, it's worth questioning whether it deserves the attention it's getting.
Where B2B SaaS Teams Get Trapped by the Wrong Data
The problem isn't just that vanity metrics exist. It's that the tools most marketing teams rely on are built to surface them by default. Ad platforms like Meta and Google are optimized to report on the metrics their algorithms care about: reach, impressions, clicks, and engagement. Without accurate conversion data being fed back to those platforms, their reporting defaults to top-of-funnel activity because that's all they can see.
This creates what's often called the attribution gap. When marketing teams rely on platform-native reporting or last-click attribution models, they get a distorted picture of which channels and campaigns are actually driving pipeline. Last-click attribution gives full credit to the final touchpoint before a conversion, which is almost always a branded search or a direct visit. Every awareness and consideration touchpoint that influenced the buyer's decision gets zero credit.
In B2B SaaS, where buyers typically interact with multiple ads, content pieces, and channels over weeks or months before converting, last-click attribution is especially misleading. A LinkedIn ad that introduced a prospect to your product, a retargeting campaign that kept them engaged, and a case study that built conviction all contributed to the deal. Under last-click attribution, none of them get recognized.
The practical consequence is that teams cut channels that are actually working. A paid social campaign that generates strong awareness but rarely appears as the last touch before a conversion looks like it's underperforming. Budget gets reallocated toward branded search, which captures demand that other channels created. The team feels like they're optimizing, but they're actually just concentrating spend on the harvest while defunding the planting.
The compounding problem is that decisions made on bad data create a cycle that's hard to break. Misattribution leads to budget misallocation. Budget misallocation reduces actual ROI because the channels that drive early-stage influence are underfunded. Declining ROI makes it harder to justify marketing spend to leadership. Leadership asks for more proof of impact, and the team responds by surfacing more vanity metrics because they're the easiest numbers to show. The cycle continues.
Breaking out of this cycle requires more than better intentions. It requires better infrastructure, specifically the ability to track the full customer journey from first ad interaction to closed deal and to distribute credit across every touchpoint that contributed. That's where multi-touch attribution and server-side tracking become essential, not optional.
Building a Metric Framework That Connects Ads to Revenue
A practical metric framework for B2B SaaS marketing doesn't eliminate awareness metrics. It organizes them by purpose and ensures that budget decisions are driven by the metrics closest to revenue.
Think of it in three layers. The first layer is awareness metrics: reach, impressions, and share of voice. These are worth tracking as context, but they should never be the primary basis for budget decisions. They tell you how visible your brand is, not whether that visibility is converting into pipeline.
The second layer is engagement metrics: click-through rate, time on site, scroll depth, and video completion rate. These are useful for creative diagnostics. If CTR drops on a specific ad set, that's a signal to test new creative. If time on site is low for a landing page, that's a signal to improve the message or the offer. Engagement metrics help you understand what's resonating, but they don't tell you what's generating revenue.
The third layer is conversion metrics: cost per lead, cost per qualified lead, cost per sales-accepted opportunity, cost per closed deal, and revenue attributed by channel and campaign. These are the metrics that should drive budget allocation. When cost per opportunity is lower on one channel than another, that's a signal to shift spend. When a specific campaign is generating attributed revenue at a strong return, that's a signal to scale.
The mechanism that makes this framework work is multi-touch attribution. Instead of giving all credit to the last click or the first touch, multi-touch attribution distributes credit across every interaction in the customer journey. Models vary, including linear attribution, time decay, position-based, and data-driven approaches, but the common thread is that every touchpoint that influenced a deal gets recognized. This gives marketing teams an accurate picture of which channels and campaigns are actually contributing to pipeline.
Underlying all of this is the quality of the conversion data you're collecting. Browser-based pixel tracking has become significantly less reliable due to ad blockers, iOS privacy changes, and cookie restrictions. Server-side conversion tracking captures events at the server level rather than the browser, providing more complete and accurate data. This is the foundation for sending high-quality signals back to ad platforms through tools like the Meta Conversion API and Google Enhanced Conversions, which improves how those platforms optimize your campaigns going forward.
First-party data, collected directly from your own properties and CRM, is the cleanest input for this kind of attribution. The more accurately you can capture what happened across the customer journey, the more reliable your conversion metrics become, and the more confident your budget decisions can be.
Turning Actionable Metrics Into Smarter Ad Decisions
Measuring the right metrics is only half the equation. The other half is using those measurements to improve how your ad platforms perform. This is where the feedback loop between your attribution data and your ad platform algorithms becomes a genuine competitive advantage.
Ad platforms like Meta and Google use machine learning to optimize toward the conversion signals you send them. If you're sending clicks or page views as your conversion events, the algorithm learns to find people who click. If you're sending qualified leads, sales-accepted opportunities, or closed deals, the algorithm learns to find people who actually convert into revenue. The quality of your conversion signal directly determines the quality of your targeting.
Feeding accurate, revenue-level conversion data back to ad platforms through tools like the Meta Conversion API and Google Enhanced Conversions gives their algorithms a much stronger signal to work with. This improves targeting efficiency over time, reduces wasted spend on users who are unlikely to convert, and increases the return on your ad investment without necessarily increasing your budget.
AI-powered analysis of actionable metrics takes this further. When you have clean, connected data across ad platforms, CRM, and revenue, AI can surface patterns that are difficult to identify manually. Which specific ads are driving the most pipeline? Which audience segments convert at the highest rate from first touch to closed deal? Which campaigns have strong CPL but poor downstream conversion, suggesting a lead quality problem rather than a volume problem? These are the kinds of insights that lead to confident scaling decisions.
The practical decision loop looks like this. Start by measuring cost per pipeline opportunity by channel. Identify which channels are generating opportunities at an efficient cost and which are not. Reallocate budget toward the channels and campaigns with the strongest revenue attribution. Monitor the impact in real time and adjust as new data comes in. Then feed updated conversion signals back to your ad platforms to improve their optimization for the next cycle.
This loop is not complicated in principle. The challenge is that it requires all your data to be connected. Ad spend data, CRM data, and revenue data need to be in one place before this kind of analysis is possible at the speed that modern campaign management requires. When that infrastructure is in place, the shift from reporting on impressions to making revenue-driven decisions becomes straightforward rather than aspirational.
Shifting Your Marketing Culture Toward Metrics That Matter
Even teams that understand the difference between vanity metrics and actionable metrics often struggle to make the shift in practice. The reason is usually organizational rather than technical. Marketing teams report vanity metrics because leadership asks for them, because they're the easiest numbers to pull, or because revenue-level data is siloed across too many systems to surface quickly.
When the CMO asks for the weekly update and the only numbers available are impressions, clicks, and open rates, that's what gets reported. Not because the team doesn't care about pipeline, but because the infrastructure to connect ad activity to revenue isn't in place. The result is a reporting culture built around what's accessible rather than what's meaningful.
The most effective way to change this is to establish a single source of truth that connects ad spend, CRM data, and revenue in one place. When every stakeholder, from the marketing manager to the CFO, sees the same numbers and those numbers show pipeline and revenue attribution rather than just impressions and clicks, the conversation changes naturally. Leadership stops asking about reach and starts asking about cost per opportunity. Marketing stops defending impression counts and starts presenting revenue impact.
A single source of truth also removes the temptation to cherry-pick favorable metrics from different platforms. When your Meta Ads Manager, Google Ads, CRM, and revenue data all feed into one unified view, the picture is complete and honest. That honesty is uncomfortable at first, but it's the foundation for making better decisions and earning greater trust from leadership.
A practical starting point is a dashboard audit. Look at every metric currently in your primary reporting and ask one question: has this metric influenced a budget or creative decision in the last 90 days? If the answer is no, it's a candidate for deprioritization. It might belong in a secondary diagnostic view, but it shouldn't be taking up space in the report that drives decisions. This audit often reveals that a significant portion of what teams track regularly has never changed anything. Clearing that noise creates room to focus on the metrics that actually matter.
The Measurement Shift That Changes Everything
Moving from vanity metrics to actionable metrics isn't just a change in what you track. It's a change in how your entire marketing operation thinks and makes decisions. Teams that measure what connects to revenue make better budget decisions. They justify spend more confidently. They scale campaigns with less risk because they can see what's working and why.
The B2B SaaS context makes this especially important. Long sales cycles, multi-channel buyer journeys, and high customer acquisition costs mean that every measurement error compounds over time. Optimizing for impressions when you should be optimizing for pipeline is an expensive mistake that gets more expensive the longer it continues.
Cometly is built specifically to make this shift practical. It connects your ad platforms, CRM, and website data into a single real-time view that shows exactly which ads, channels, and campaigns are driving leads and revenue. With multi-touch attribution, server-side conversion tracking, and AI-powered analysis, Cometly gives you the complete picture of your customer journey and the tools to act on it confidently. You can compare attribution models, identify high-performing campaigns, and feed enriched conversion signals back to Meta, Google, and other platforms to improve their targeting over time.
If your current dashboard is full of numbers that look good but haven't changed a single budget decision, it's time to see what your data actually looks like when it's connected. Get your free demo and start tracking the metrics that move your business forward.



